


Using data to map the profitability of VR
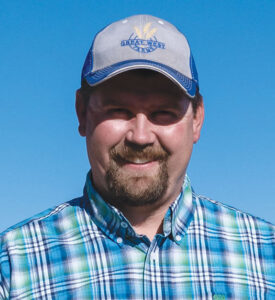
Wayne Schneider, an Alberta Canola director who farms at Nisku, is back using variable-rate (VR) fertilizer applications on his farm – but he doesn’t know whether it provides a return on investment.
“Right now, I can’t answer that question,” he says.
Schneider is working with Conservis, a farm data management company based in Minneapolis, Minnesota, to find out. The Conservis connection came through his MNP accountant and John Deere dealership. The dealership and MNP saw opportunity to work together to match the producer’s data from each source – the individual producer’s accounting data from MNP with application and yield maps from John Deere Operations Center – to come up with more detailed profit maps for each field, and potential other decision-making data. They needed farmers to be part of the pilot project, and they asked Schneider. They also needed a data management company with experience pulling it all together. They found Conservis.
Conservis, which Telus Agriculture and Rabobank purchased in 2021, provides farms with what Conservis calls “zone economics.” It combines all field map data, including application and yield maps, with soil test results and itemized costs of production to provide “high-resolution insights into cost-per-bushel production performance across a field,” says George Hadjiyanis, Conservis vice president of sales and marketing.
“Our growers work with their trusted agronomy advisors to make the best agronomic production decisions for their farm. Strip trials or field by field comparison enable growers to make better informed decisions, and Conservis looks to be the partner along with their agronomy advisor in helping bring valuable data to determine best practices.”
—Bryant Boyer
These insights can answer questions like: What was my most efficient seeding rate? Did my seed variety give me the return (not yield) that was expected? What is my most economically optimal rate of fertilization? How do I limit economic losses in areas of fields that don’t produce so I can improve overall return?
“It should show how profits adjust up and down if I take out a chemical application or adjust fertilizer rates, for example,” Schneider says.
When asked if Conservis recommends that farmers run replicated treated-untreated trials to test the economic return from certain practices, the company’s sales engineer Bryant Boyer says the focus is on workflows and cost of production. “Our growers work with their trusted agronomy advisors to make the best agronomic production decisions for their farm,” Boyer says. “Strip trials or field by field comparison enable growers to make better informed decisions, and Conservis looks to be the partner along with their agronomy advisor in helping bring valuable data to determine best practices.”
With VR fertilizer maps, Conservis analysis should be able to show, over time, how higher or lower rates affect profitability per acre. “I want to look at numbers over a number of fields and years,” Schneider says. Only then does he feel he can say whether VR fertilizer application is more profitable than a flat rate for each field.
Schneider got back into VR fertilizer again after upgrading his seeder tank. The first time he tried it eight years ago, or so, his tank had a ground-drive meter adjusted with an electronic solenoid. “It could take 30 seconds to fully change rates,” Schneider says. He could see the map and the rate adjustment on the monitor and the amount of lag was “silly,” he says. So he gave up.
Schneider now has a John Deere 1910 tank with a hydraulic-powered meter that provides instantaneous adjustment. The tank has three compartments, one for seed, one for the seed-row blend and one for urea. For canola, he creates VR maps for the urea only.
He pays for outside help to do all soil testing and build the maps. The package deal costs around $8 per acre. For the sake of round numbers, let’s put the urea price at $1,000 per tonne. In 2022, Schneider had a canola prescription map with five zones with urea rates ranging from 124 lb./ac. at the low end and 232 at the high end. At $1,000 per tonne, his urea costs, based on those rates, would be $56 per acre at the low rate and $105 at the high rate. Does this variable application improve Schneider’s profits? Or would he be further ahead spending the same amount of money for urea but skipping the $8 per acre and applying the same rate for each acre? That is what he hopes to find out. When he does find out, Canola Digest will write another article. In the meantime, the magazine shares this experience to highlight an important consideration for any investment in precision agriculture: Yes, it may make logical sense. But does it pay? Or will it pay, eventually?
First steps
Canola Digest asked a few data experts to answer this question:
What do you think is a good first step for farmers who want to put their data to work — to reduce costs and increase profitability?
Kris Kinnaird
Head of marketing and customer experience, Farmers Edge
“The first step to putting your data to work is ensuring accurate, real-time collection of all critical datasets, ideally as passively as possible. This means bringing together crop plans, agronomic data, operational data, weather data and equipment data all to one place, in a clear, consistent format. Farmers have always managed their data in some shape or form, but the challenge has been bringing it all together so they can analyze it, draw insights from it and accurately measure the cost of their decisions.”
Farmers Edge has an end-to-end platform, FarmCommand, that allows farmers to visualize, analyze and understand their data. Site-specific data is collected automatically and transformed into actionable insights and predictive models. Data is securely stored for easy access and sharing from anywhere.
For more information visit farmersedge.ca/farmcommand
Matthew Eves
Digital farming lead, Bayer CropScience Canada
“A good first step is to get existing data captured and uploaded into one place. Farms often have fertilizer rates and harvest yields going back a few years, and some of it is still on USB drives stacked beside the computer. A program like Climate FieldView can provide a very basic start point for farmers who have data and want to use it to get a baseline of what’s going on on the farm. FieldView has a data inbox to upload field reports from all colours of equipment. With fertilizer rate and yield data uploaded, farms can start to see how the data might be useful in the future. It could be for variable rate maps. It could show nutrient use efficiency – if needed for sustainability and carbon sequestration programs.”
Climate FieldView staff can help farmers upload their data and run basic analysis. Climate FieldView has many helpful videos at youtube.com/c/climatefieldviewcanada. To start, Matthew Eves recommends “A new look at FieldView: Product video” and “Data-driven farming in 2.5 minutes using the FieldView app.”
For more information visit climatefieldview.ca/features.
Erin Petrichuk
Digital ag enablement lead, Syngenta Canada
“Calibrated and accurate yield data is key to maximizing profitability. Record keeping of multiple years in a format that makes it easy to see cost per acre per field is important as well. Grain sales and storage records can also be very helpful in looking at profitability. Data is only as good as the information you are getting out of it. Lots of customers collect tons of data but don’t know how to work with it. Start simple with yield, input costs and grain inventory and sales. Agronomic inputs are the next step with soil definitely being the key.”
Richard Marsh, digital ag manager with Syngenta Canada, adds: “If you don’t consistently soil test, now is the time to start. Consider working with an agronomist to discuss potential benefits of soil sampling at a higher resolution to enable variable rate fertilization. Compare the yield maps to the as applied fertilizer maps to help calibrate your future fertilization rates and implement the 4Rs of nutrient stewardship. The next step after optimizing data collection is to implement on farm trials, which could be trying a new seed variety, fertility or fungicides, preferably using a replicated and randomized design. Setting up and collecting data in this format takes some time and effort, but the payoff is collecting actionable data from your own farm.”