


Are Canadian canola growers the most profitable?
Are Canadian canola farmers as profitable as canola and rapeseed farmers in Australia, Eastern Europe and Western Europe? An initiative from agri benchmark can tell us. The not-for profit organization jointly managed by the Johann Heinrich von Thuenen Institute in Germany and Global Networks compares practices and results for so-called “typical farms” in about 50 countries. (See the sidebar for more on the organization.)
The core strength of agri benchmark is its grassroots connection to agriculture in partner countries through an extensive network of locally anchored scientists, extension specialists, consultants and of course farmers who provide first-hand insights about the farming situation and about strategic developments in the region.
In Canada, agri benchmark maintains six typical farms – two in Ontario, two in Manitoba and two in Saskatchewan. With a recently established partnership between Farm Management Canada and agri benchmark, this will extend to Alberta and Quebec.
For this analysis, typical canola/rapeseed growing farms from Canada, Poland, Romania, Ukraine, Germany, Denmark, France and Australia were chosen. While all the farms in Eastern Europe and Western Europe grow winter rapeseed, the Australian and Canadian farms grow spring canola.
Since the farm data displayed in the subsequent graphs comprise a selection of individual farms, the range of data is indicated. Even though we use country codes, we do not claim that the data is representative for the entire country, but rather to represent data from typical farms in the agri benchmark database.
Outcomes
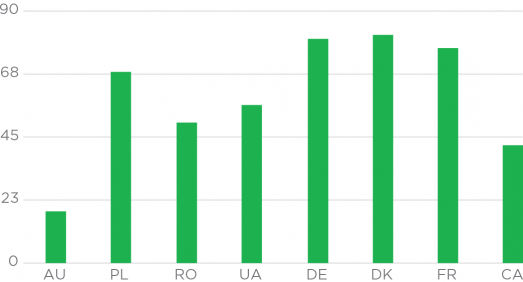
Yield. Canadian canola yields are below most of the farms in the sample. Australian farms also had very low yields, due to low precipitation. In Europe, long-time precipitation averages range from 550 to 750 mm per year, and they grow long-season winter varieties. These factors help to explain the much higher yields in Europe than in Canada and Australia. Average yields of the farms are shown in Figure 1.
Figure 1. Average rapeseed yields, 2012-2015, in bu./ac.
AU – Australia
PL – Poland
RO – Romania
UA – Ukraine
DE – Germany
DK – Denmark
FR – France
CA – Canada
Farmgate canola price. Canadian farms, with an average farmgate
price of US$442 per tonne, were not able to realize prices quite as
high as the farms in other countries. Farmgate prices were US$560
in Denmark, for example. However, Eastern European farms in Romania
and Ukraine realized even lower prices, at US$431 and US$418
respectively. Figure 2 shows the average farmgate prices of the agri
benchmark typical farms.
Figure 2. Average rapeseed prices, 2012-2015, in US$ per tonne.
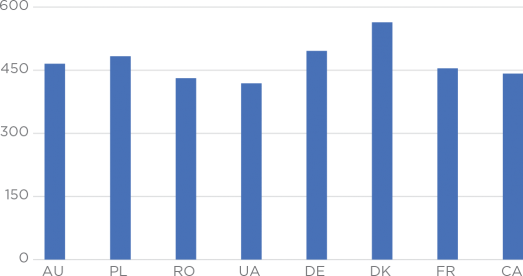
The price discount in Canada is most likely the result of fewer end users in close proximity of the farms. Therefore Canadian canola requires increased transport costs to reach export markets, which comes off the farm gate price.
Seed and herbicide costs. Canadian farmers are clearly paying more for seeds than the rest of the world, but considerably less for herbicides. (See Figure 3.) This is likely due in part to the genetically-engineered (GE) herbicide-resistance systems that account for most of the market. In Canada, 95 per cent of canola is GE herbicide resistant. In Australia, the share is at around 15 per cent, but growing rapidly. Due to consumer and subsequent political concerns, GE rapeseed is not in use in European countries.
Figure 3: Average seed and herbicide costs, 2012-2015, in US$ per acre.
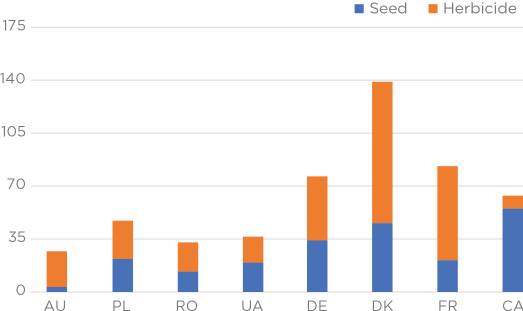
The seed-to-herbicide ratio in the Canadian farms is about 6.2:1, while it is closer to 1:1 in the Eastern European farms, 1:2 in the Western European farms and 1:7 in Australia. For the Canadian farms, a clear shift in the structure of direct cost from herbicides to seeds can be observed.
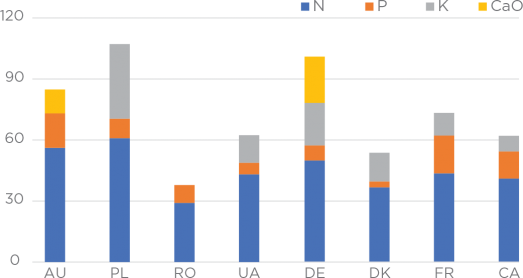
Fertilizer. A deeper look at the fertilizer efficiency shows that the Canadian farms are efficiently converting nutrients into final commodity (see Figure 4). Since the average nitrogen withdrawal per tonne of canola is about 35 kg of Nitrogen (N), Figure 4 allows the suggestion that the Romanian farm is probably depleting the soil over the long run.
Figure 4: Average fertilizer efficiency, 2012-2015, in kg nutrient per tonne of product.
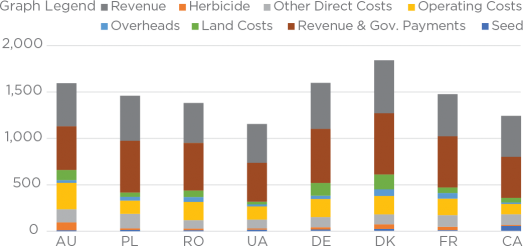
Operating and land costs. All the above so far suggests that Canadian farms are not competitive – lower yields, lower prices and higher direct costs. Figure 6 shows the total costs in relation to the revenues, which include government payments. Although the Canadian farms have high direct costs, they make up this disadvantage with lower operating and land costs and show good profitability – overall slightly lower than the lowest-cost producers in Ukraine. With higher operating and land costs, producers in the European Union would break even or produce at a loss if it wasn’t for government payments. Observed farms in Australia produced at a loss, mainly due to very low yields.
Figure 5: Direct cost structure, 2012-2015, per cent of total direct cost.
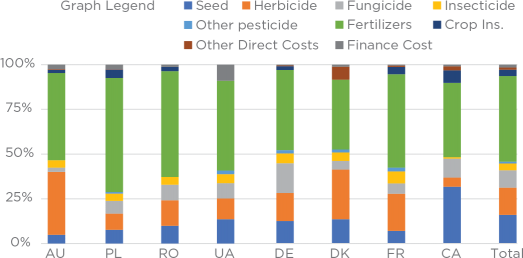
Figure 6: Revenues, government payments and total cost, 2012-2015, US$ per tonne.
The economic and agronomic benefits from having access to herbicide-resistant varieties likely resulted in the ability of growers to increase the share of canola in their rotations and therefore increase overall profitability of the rotations.
Conclusion
Despite significantly higher seed costs, Canadian canola production is very competitive in an international comparison. One reason is much lower herbicide cost. And since the canola acreage has gone up significantly in recent years, it can be assumed that the highest seed costs in the world have not hurt the overall profitability of the crop. The economic and agronomic benefits from having access to herbicide-resistant varieties likely resulted in the ability of growers to increase the share of canola in their rotations and therefore increase overall profitability of the rotations.
However, not everything should be attributed to GE herbicide-
resistant (HR) technology. The fact that hybrid varieties (higher yields, drought resistant, etc.) were introduced in combination with the HR technology may have also affected profitability and the increase in canola acres.
As stated above, the Canadian canola producers have comparably high direct costs per tonne, but very low operating costs overcompensate for this. The area to improve in is, therefore, the direct costs. Besides fertilizer, which cannot be reduced without sacrificing yield, seed is the second biggest direct cost position. Focusing on reducing seed costs without agronomic sacrifice by employing more precise seeding technologies allows Canadian producers to reduce their direct costs per tonne of canola even further and therefore become even more competitive.
Further research
Since the vast majority of canola in Canada is GE, it is hard to find relevant data to isolate the effects of the technology within Canada. However, the adoption of GE canola in Australia is still taking place and more data should be available to compare conventional and HR production systems. The hypothesis that HR canola allows for a higher share in the rotations due to easier weed management could be tested further.
Greenhouse gas emissions (GHG) from crop production is becoming an increasingly important issue for decision makers around the world. Therefore, analyzing the efficiency of nitrogen use (as the single most important source of GHG emissions in canola production) should be of interest to the Canadian canola industry.