


How to use technology to manage yield
Precision agriculture tools collect and fuse together field-level information to help farmers measure variability, manage operations more effectively and make on-farm decisions in real time. By measuring variability, precision tools help identify low-productivity areas so farmers can develop a plan on how to handle these areas moving forward. From weather stations to in-cab hardware, field sensors, predictive modelling and prescription maps, the precision ag toolkit is only growing. While some of these tools are staples for producers, some are not being applied to their fullest potential.
This article will detail three precision tools that currently have small uptake but can deliver big benefits to improve profitability, productivity and environmental sustainability.
TOOL ONE: Satellite imagery to provide Early intel on yield
Satellite imagery is mainly used for direct scouting and ground-truthing efforts, ending the need to walk a “W” pattern through the field. One untapped opportunity with satellite imagery is early yield estimates.
Early-season imagery of crop growth can be a strong predictor of yield. When reviewing field health imagery of canola in late June or early July, producers and agronomists will already be able to potentially see the highest- and lowest-yielding areas within fields based on biomass shown in the imagery. After years comparing those images to yield maps at harvest time, users see how closely they match. Ongoing research into yield forecasting at the Olds College Smart Farm shows that by reviewing imagery to identify areas with higher and lower biomass and then using it as a guide to ground truth the data with in-field agronomic assessments of the crop, it shows the potential to use satellite imagery for virtual yield mapping.
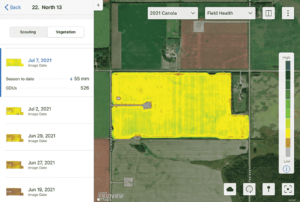
Source: Climate FieldView
If early season imagery paints a good picture of what yield maps will look like in the fall, producers can use this information to help inform grain marketing decisions.
For example, if yield potential is higher or lower than expected, producers can take early action to buy bushels – if they may be short on a contract – or consider pricing more if it looks like a year for higher yields across the board. This is how in-season satellite imagery could improve profitability.
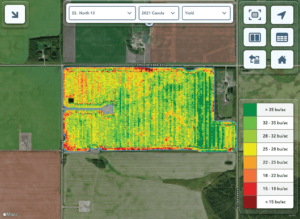
See the two maps from the same canola crop in 2021. The first is a field health image from July 7, 2021. You’ll see low vegetative areas in the bottom right and upper left corners. The second map, the yield map, shows that both of those low vegetative areas were poor yielding
at harvest.
Vegetation or biomass imagery is available from several providers. Most crop input suppliers, grain buyers and agronomists in your area are working with an imagery provider who is offering this service. It can be very accessible, with imagery uploaded to your smart phone and tablet apps on a regular basis – almost daily, depending on cloud cover. The cost for an imagery subscription can be very inexpensive, with providers offering free trials for up to a year. Farmers who are new to imagery and want to understand what the maps are telling you, ask a trusted advisor to show you what they are using and commit to looking at imagery of your own fields throughout the growing season to see what kind of insights you can learn from your crops.
TOOL TWO: Weekly tissue testing to show nutrient shortages
Being a student of the crop is a key part of developing strategies to improve yields. A tissue testing program can identify nutrient shortages, and point to fertilizer blends that could increase productivity in each field.
Start by collecting tissue samples regularly, weekly for example, during the growing season and sending them for testing. Results will show nutrient levels in the plants throughout the season, how they vary, and how much nutrient the crop takes up.
Evaluating the analysis of the weekly tissue samples and correlating the amounts of nutrients in the plant to accumulated growing degree days (GDDs) and crop growth stages can help establish a baseline to verify what nutrients your plants are taking up and what, if any, nutrients are possibly constraining yield.
A weekly tissue testing program starts when canola is at the two- to four-leaf stage and continues until the plant starts to senesce or dry down, so plan to take about 12 samples during the growing season. A complete plant tissue analysis is going to cost about $40, so for less than $500 you will get a complete season of information about what the levels of nutrients are in your canola plants during each growth stage. In the first year, take the samples on the same day of the week and at the same time of day to maintain consistency. You will also want to have the local accumulated GDDs for each sample time. When you take samples the following growing season, it won’t be on the same day of the week but at the same GDD as the previous season. It requires a commitment to take the samples and send them to the lab every week, so work with a local agronomist who can help take the samples if you are going to be away. Start with one field the first year and add more fields after you feel comfortable with the process.
Comparing these plant sample results to established sufficiency charts can show opportunities to improve crop nutrient programs and push yields. (See more on sufficiency needs in the Nutrient Management section at canolaencyclopedia.ca.) Harvest grain samples help pull all this information together. They show how nutrient levels provided a yield response, which will help you build your own standard numbers and plan future fertilizer applications more accurately, which is the perfect segue into our third tool.
TOOL THREE: Precision rates of fertilizer
Soil tests gathered from the same areas as the tissue samples will help producers and agronomists plan for the right rates of fertilizer. “Right rate” is one of the 4R nutrient stewardship practices. (Read the 4R chapter in the Nutrient Management section at canolaencyclopedia.ca.) The right rate means that you are using the right amount of fertilizer, based on levels shown in soil test results and canola’s nutrient requirements, to achieve your yield target. Rather than fertilizing all canola fields the same, you can apply fertilizer more precisely – a practice that is not only good for the environment, but good for your bottom line.
A soil test can be seen as your fertilizer bank account. You know what you put into the account and, with yield information, you know what should have been removed. A soil test will show exactly what’s remaining, without the guesswork. Fertilizer is a large investment to make based on gut instincts or what your neighbours are doing or seeing in their fields. We know that every field, and every acre, is different, so it’s important to treat fields independently when planning for the right rate.
All about measurement
We’ll sum it up with a simple mantra that everyone has heard: “You can’t manage what you don’t measure.” Collecting data through precision ag tools will help you measure and understand the variability between your fields, so you can better manage that variability and make informed decisions based on what the data is showing.

Working with precision tools can come with a bit of a learning curve. It could take a couple seasons until you really understand what the data is telling you, so you can apply it to decision making. This investment in time is an important step in adopting these tools.
Since farmers have a lot of commitments, from in-field operations, to managing contracts and other employees, to hauling grain, it can be hard to justify taking a different approach that will require more time. But spending the time reviewing farm data from an overall perspective is a great place to start – before you dive in deeper and start analyzing smaller units. Another option is to give trusted advisors, like your agronomist, for example, access to this field-level data so they can work with you to develop a strategy.
The beauty of precision ag is that it allows farmers to become their own on-farm researcher. You can take general precision ag concepts, test them to see the response in your fields and then fine tune them to align with your growing conditions. It may take an investment in time, but the benefits will make the time worthwhile. By starting to adopt these precision tools on a field basis, you’ll have a better data pool for when you decide to adopt variable rate technology.