


What do you do with data?
Data, data everywhere but not a way to use it. That may be how farms feel when they consider combine yield maps, thumb drives, computer spreadsheets, notebooks (paper and phone) and wonder how to make better use of it all. Canola Digest asked its six panelists, how do you put your data to work?
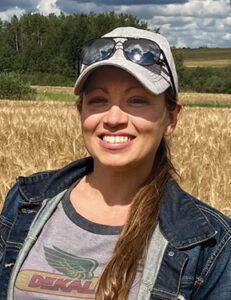 Melissa Damiani
Bluffton, Alberta
“I’m an agronomist and these detailed notes help jog my memory. For example, if 2016 was a similar year, weather-wise, I can go back and check whether we sprayed fungicides or what weeds were a problem.”
—Melissa Damiani
Melissa Damiani, shown above with her husband, Jason, has a lot of data but she doesn’t use high-tech methods to collect and apply it. She uses a binder and a white board. “Manual data collection works for us,” she says.
The binder is arranged field by field, with information from this year and past years. It includes hail and rain events, scouting results and products sprayed. “I’m an agronomist and these detailed notes help jog my memory,” Damiani says. “For example, if 2016 was a similar year, weather-wise, I can go back and check whether we sprayed fungicides or what weeds were a problem.”
Spray details include product, date applied, product and water rates, and conditions at the time of spraying. Damiani also writes summary reports for each field each year, including cultivars planted and what they liked and didn’t like about product decisions.
The white board is in the shop where everyone gathers each morning. The board marks key events for the year, including hail dates and spray dates, for easy reference. It also shows the plan for the day – what herbicides will go on what fields, for example. Though low tech, Damiani also links the platforms. “White board notes all go in the binder,” she says.
Damiani will use high tech options. She has access to NDVI field maps through Echelon, a division of Nutrien (she is branch manager for Nutrien in Rimbey), and Climate FieldView. The maps show crop biomass levels across fields, which she uses as a scouting aid. “We can look for problem areas growing,” she says. If the map shows a low biomass area that’s not a known slough or saline patch, they walk the field to check it out.
Damiani knows there are more high-tech ways to make use of data, including variable rate maps. “But we don’t have VR-capable equipment,” she says. “So at the end of the day, if I’m not going to act on the data analysis, what’s the point of paying for it?”
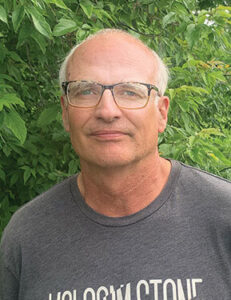 Murray Lewis
Cleardale, Alberta
“If you want to be sure of something, test it just once. You might be ignorant, but you’re confident.”
—Murray Lewis
Murray Lewis collects a lot of data but he doesn’t have a lot of confidence in the interpretation. Fields have so much variability to begin with, it can be a challenge to accurately identify differences in treatments, he says. Ten strips through a field with the same treatment corner to corner can provide quite different yield results for each strip. Even along strips, variability can be high.
“If yield variation along the strip is wide, I will have less confidence in results from a strip to strip comparison,” he says.
That doesn’t stop Lewis from using his on-farm data to make decisions. “Absolutely I do that. When I want to try something new, I run quite a few tests in one year. If results are positive, I might adopt it generally. But I also want to test it again the following years.”
Results the next year may confound, or be the opposite to, results from the first year, but with enough tests patterns may start to show, Lewis says.
“If you want to be sure of something, test it just once,” he says. “You might be ignorant, but you’re confident.”
Lewis would like a data-management tool that addresses a few of his wishes. First, he’d like the database of results to contain analysis from this year and previous years. He doesn’t have that now, which makes it more difficult to compare old results with new results, or re-query historical data. Second, he’d like a tool that weights the quality of data. One year might have great growing conditions that increase confidence in trial data. The following year may have a challenging harvest, with weather delays and muddy combining conditions that may result in “crappy” data. Rather than throw out the bad data, he’d like to keep it but have a program that automatically weighted the data based on seasonal conditions and other quality parameters. Third, he’d like a tool to improve his confidence in small differences. “A one bu./ac. difference in yield for a product that costs only a few dollars per acre might actually provide a return on investment, but statistical analysis will say the result is not significant,” Lewis says. “These small differences are very difficult to measure.” But they might be real.
Finally, he says many of his data-informed decisions are minor compared to the yield effect of weather. “I might quibble over a decision that makes a two bu./ac. difference in yield when weather makes a 30 bu./ac. difference,” he says. “A person could do everything wrong but still win in a good weather year.”
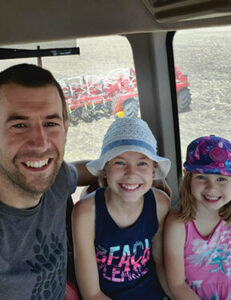 Ryan Sawatsky
Killarney, Manitoba
“As farmers, we’re often reluctant to predict what the future holds, but with accurate data analysis we can improve our forecasting and move from good guesses to better guesses.”
—Ryan Sawatsky
Ryan Sawatsky often wonders about inaccurate data and, possibly more deceiving, inaccurate analysis of good data. “Analysis can go sideways quickly with our biases,” he says. With confirmation bias, people tend to look for data that supports their thinking and ignore or downplay what doesn’t. Sawatsky also mentions complexity bias – “people are more prone to believe simple lies, not complex truths” – and recency bias. “We know next year is going to be different than this year, but we often make seed variety decisions based on what happened this year,” he says. Sawatsky has to remind himself to check his biases when making data-based decisions.
For Sawatsky, one important source of farm data checked by various sets of eyes are his year-end statements. Because he hires outside expertise to verify the numbers, Sawatsky has confidence that they’re accurate. He has generational year-end statements going back to 1973. Interestingly, the drought year of 2021 was one his most profitable years in the past 25 – even though yields were his worst in 25 years. Drought meant lower input costs and higher grain prices, which made up for lower yields. “We wouldn’t know that if we didn’t do accurate economic analysis,” he says.
A key part of economic analysis is yield data. Sawatsky builds in redundancies to check and re-check the numbers. He has combine yield data which he verifies with scales on the grain cart. Then he compares that to grain delivered through the year. “If the numbers don’t match, then I know I shouldn’t make too many decisions based off of my yield maps,” he says.
There’s no guarantee that decisions made will be the best ones, but unbiased assessment of good data improves the odds. “As farmers, we’re often reluctant to predict what the future holds,” Sawatsky says, “but with accurate data analysis we can improve our forecasting and move from good guesses to better guesses.”
 Josh Heidt
Kerrobert, Saskatchewan
“The key with data is to “hire someone in tune with how to
use it.”
—Josh Heidt
Data management is definitely a weak point for us,” says Josh Heidt. They collect data with the seeders, sprayers and combines, “but I’m not sure we do much productive with it.”
He adds, frankly, “I don’t even know what we would do with a lot of it.”
Their drills collect seeding rate and seeding speed data the combines collect yield data. In theory, one could use the combine yield maps to cross reference seeding rates and speeds to identify correlations to make better seeding decisions. However, Heidt hasn’t been confident in the accuracy of combine yield maps. “We have six units, and there has been quite a bit of variation among them,” he says. The technology is getting better, he adds.
The farm does use soil test and topography data to create prescription maps for variable rate fertilizer application, which they use on all acres. The Heidts work with Max Ag Consulting to build the SWAT maps. “Variable-rate fertilizer application is beneficial, for sure,” Heidt says. “We can identify the most productive and least productive parts of the farm so we can get the most out of our high-yielding areas.” Before variable rates, they were applying the same rate of fertilizer across fields, “even in areas that could only yield 10 bu./ac.”
Heidt also collects NDVI images – satellite images that show in-season biomass differences across fields. “For cereals and canola, there is a high correlation between biomass and yield.” They use this information to verify and support SWAT maps.
The key with data, Heidt says, is to “hire someone in tune with how to use it.”
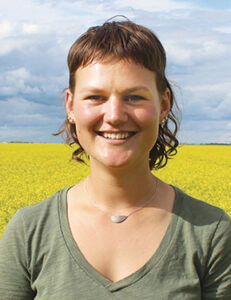 Fiona Jochum
St. Francois Xavier, Manitoba
“We want to make sure there’s a reason for everything we do. We want to
make money.”
—Fiona Jochum
Fiona Jochum collects accurate yield data by weighing every grain cart load and using that to ground-truth the combine yield monitors. With that information, along with moisture measurements, the farm has a very accurate assessment of grain in the bins. From that accurate start point, Jochum tracks the weight and price for every load that goes out. “We know exactly what we have left to sell,” she says.
Jochum also uses yield maps to check on decisions made on each field. For example, in 2020 they ran out to time to till all fields in fall, so in the spring of 2021, some soybeans went into fields that were tilled and some went into fields that just got a harrow pass. “Min-tillage is not that common in the Red River Valley. The popular belief is that we need the soil black so beans pop out of the ground quicker,” Jochum says. The situation gave them an opportunity to test that belief.
“Throughout the year, it looked as though beans on no-till were behind, but I think it was an optical illusion. Green plants on black soil will tend to look larger,” Jochum says. At harvest, yield data showed no difference. So the Jochums asked themselves, why are we tilling?
“We want to make sure there’s a reason for everything we do. We want to make money,” Jochum says. “So maybe we don’t need to turn everything black.”
In the fall of 2022, their only tillage was to get rid of sprayer ruts. Fields have a tillage pass every 120 feet, so “our fields might look funny to the neighbours,” she says.
To give one more of example of putting data to use, the Jochums use Climate FieldView climate crop index (CCI) vegetative maps to make timing decisions for fungicide and pre-harvest sprays. “From the road, canola may look mature enough to spray but the map shows a high level of green biomass,” she says. “So we go check and the field isn’t as mature as we thought.”
 Breann and Bryce Moore
LeRoy, Saskatchewan
“For example, in a year with high temperatures at flowering, I can see which genetics handled it best.”
—Breann and
Bryce Moore
The Moores use PRS Cropcaster from Western Ag (Bryce is an agronomist with Western Ag) to predict yield and set fertilizer rates based on soil nutrient analysis, available moisture from soil reserves and snow, forecast rain and maximum anticipated temperatures at flowering. For in-season rain, they enter a total of 8.5 inches, which is the 25-year average for their area. For maximum temperature at flowering, they use 30°C.
At the end of the production year, the Moores use Cropcaster to “backcast”, comparing actual yield and rainfall with what the model predicted. For backcasting, the enter total rainfall that infiltrates into the soil during the growing season. “If we get a three-inch rain, I don’t count the total amount because some of it will run off,” Bryce says. They also log actual maximum temperature at flowering, actual fertilizer rate and actual yield for each field. With this information, the Moores can see which fields are exceeding yield potential and which are falling short.
This is particularly useful for making cultivar decisions, Bryce says. “For example, in a year with high temperatures at flowering, I can see which genetics handled it best.”
Bryce also works with around 40 clients using the same program. “I get to see what they’re doing to exceed their predicted yields,” he says.
The Moores run a few replicated trials every year. In 2022, one canola trial compared strips with and without an in-season nitrogen top up. A good rainfall at late bolting brought the season total to 10.5 inches, which was well above the predicted 8.5 inches, so the Moores wanted to try a nitrogen top up to match the increased yield potential. They applied melted urea at a rate of around 10 lb./ac. of actual N, using the sprayer and flat fan nozzles. Melted urea has a very low risk of nitrogen burn, Bryce says, so dribble nozzles are not as important as they might be for UAN. “The timing was a little later than recommended for a nitrogen top up, but the canola had a lot of foliage and was hungry for nutrients,” he says. They applied nitrogen to 120 acres within the quarter, with side-by-side replicated treated and untreated strips through the middle of the field. They recorded yield for each strip using a grain cart equipped with a scale. Average yield increase for treated areas was 3.5 bu./ac., with a range of 0.5 to 5.6.