


Five canola market influences to watch
As I stood at the Grain Shark trade show booth in January, handing out iPhone-shaped brochures to passers-by, the most common question was, “When is this canola market going to stop dropping?”
A pile of things can influence the canola market at any given time. This article will describe the major influences worth watching when trying to predict the market.
The charts
Chart analysis can help clear some of the clutter. I won’t go into great detail about all the techniques, but let me do my best to provide a short summary.
Start by looking at weekly trends and ranges for canola futures for the whole year. By going back a few years, this will give you a view of how the market typically moves over a period of weeks or months. There are some key seasonal trends to watch out for. Market highs typically show up sometime in April-May or June-July, depending on the year. Watch during these timeframes for sell signals to show up on the charts, and be ready to clear out any crop you have been holding through the winter. Market lows are typically seen during harvest or sometime in January to March, depending on the year. This is why it’s important to use the seasonal rallies to forward price some canola for harvest movement and contract some canola for winter movement so you aren’t stuck selling at the lows.
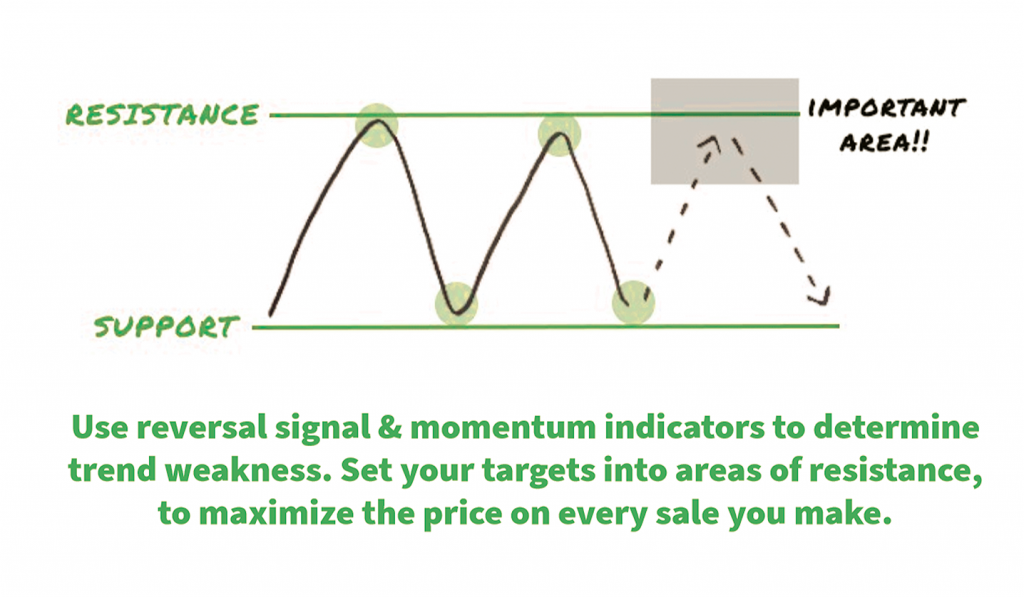
When watching the charts, look for reversals during the seasonal peaks in the markets. Reversals are patterns that show up on the charts to give you a heads up when the market is about to change direction. There are many types of reversals to watch for, so it’s important to learn them ahead of time. You can also use momentum indicators that give indication when a market is becoming overbought or oversold to help confirm the signals.
With any given sale, you always have a chance to gain a certain amount per bushel by targeting near the top end of the range or near the last high in an uptrend. That’s because traders have a psychological tendency to push prices back into normal ranges. We call that ‘resistance’ – an area on the chart where a market will tend to have a hard time getting above. We usually see resistance in a market at the top of a trend or range, into an area of previous highs in the market. You will typically see heavier selling at these prices and that’s why the market resists moving above. A wide variety of reversals, momentum indicators and chart patterns can be used, so spend some time doing the research on these terms and how to watch for them. The quick point is that chart analysis can be a major boost to the correct timing of your sales.
So what are the charts saying about canola as I write this article? The market was testing everyone’s patience on a correction down to long-term support in the $470-480 per tonne range through the month of January. Futures have held this area on several occasions in the past two years, and so far that’s the case right now as well.
For anyone looking to move canola for cash, if you needed to make bin space between January and March or if you had a deadline coming up to lock in futures on a basis, there was some upside coming based on the chart analysis at that time. We were using $494-504 as the futures target range (or a minimum cash price of $11 per bushel) to consider taking care of short-term needs. More relevant to right now, the long-term charts are also sitting in a pretty good position, even with all the weakness we have seen. There is still a good chance to see at least $520 per tonne before the crop year ends if you are willing and able to hold on that long.
Now, let’s play devil’s advocate for a second here. Some of you are thinking, “Yah, but what happens when the futures break through the $470 support and keep moving lower?” Here are some seasonal trends to consider.
Over the past four years, the market has found support at $470 two times and has ended up moving down to $440 support on three occasions. In all five instances, regardless of the fundamental outlook for the market, the futures still managed to rebound back to at least $520 into the seasonal time frame of May-July. Sometimes it just doesn’t matter what the fundamental outlook is saying. Even in times where stocks are on the rise, production is burdensome, export or crush demand is slowing, or whatever the case may be, the market ignores the info, and we still see futures run up into those higher seasonal trading ranges.
Supply and demand
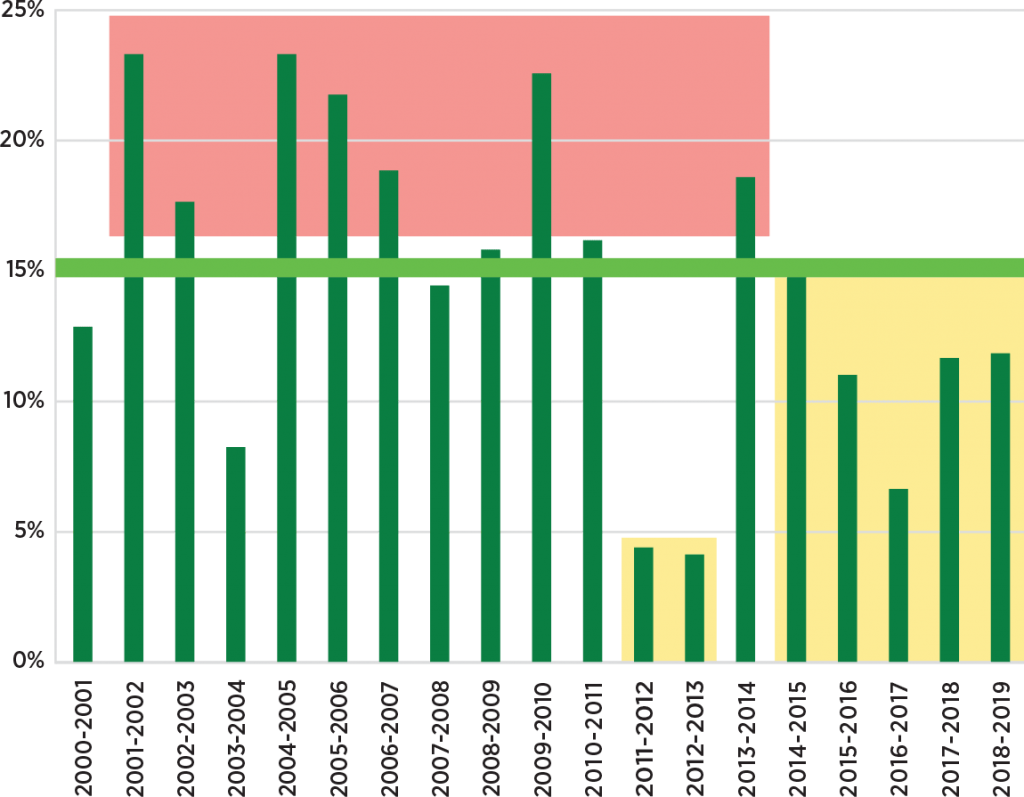
Is the current global supply of canola and rapeseed enough to meet global demand? To help answer that question, I like to lean on the stocks-to-use data – how big is the pile vs. how quickly it’s being used up? – pretty heavily because it allows you to focus on the net result rather than looking at each stat separately. Agriculture and Agri-Food Canada had stocks-to-use for canola pegged at 12 per cent in January, which is still below the 20-year average of 15 per cent. In years when stocks to use are below the average, we are feeling good. When they are above average, we start to get more negative.
On the demand side, exports and use are expected to outpace last year, even though we’ve been off to a sluggish start because of quality issues, the higher Canadian dollar and trade issues. The past year’s weather brought some big challenges for the canola crop. High green count has slowed movement in some areas as grain companies try to move out the poor quality crop. Trade issues between China and the U.S. have also made for less export activity lately, but it seems like that issue is slowly being sorted out by now.
Canada Canola Stocks to Use
Growing conditions
Weather and crop conditions around the world, especially in big oilseed producing areas like the U.S. and South America, will influence the market. These conditions will likely have changed by the time you read this, but I will still mention some of the highlights.
Western Canada was dealing with some big canola quality issues in some regions, especially green seed driven by the early frost and delayed harvest. These lower grades put some pressure on the market, but I expect to see good opportunities on better grades once the poor stuff has been dealt with.
A hot and dry December had some of Brazil expecting a 10 to 30 per cent drop in soybean production. Argentina saw some heavy rains in December and January but their crop was still in good shape. South America will remain a big player in the export market and any loss in production would support oilseed prices.
“South America will remain a big player in the export market and any loss in production would support oilseed prices.”
Australia had a rough crop year due to hot and dry conditions, leading to a 40 per cent drop in canola production estimates. The European Union had a massive heatwave and drought that affected summer crops in 2018 and also resulted in a cut back in winter rapeseed area. These crop conditions in Australia and the EU should lead to an improvement in exports for Canada in 2019.
Weather is an unreliable source of information because it changes so frequently, but it’s still fun to talk about and it gives us something to complain about when it doesn’t go our way!
Soybeans
The soybean market will always affect the canola market, so keep an eye on soy. Funding cuts to the USDA due to the government shutdown meant that traders had been missing out on important supply and demand data they normally use to help make buy and sell decisions. The December USDA data showed higher soybean production for the third straight year, but that trend may change given the stockpiles of soybeans U.S. farmers are sick of looking at. This could lead to a rise in corn acres, which would help the soybean price situation some. Stocks of soybeans are still double last year, but this could improve once some trade disputes are settled.
Some U.S. Commodity Futures Trading Commission (CFTC) funding was also cut during the government shutdown and the Commitment of Traders Report (COT) was not being published as a result. The COT report is a very important tool that the trade uses to identify strength or weakness of positions in the market. The report outlines the current long and short positions of the commercial, non-commercial and non-reporting traders. This information sheds lights on some very important trends in the market. The report is used as a setup tool for many traders and without the data, it brought some unease or uncertainty in the market. Hopefully by the time you read this, the government shutdown has ended and funding has been restored to both USDA and CFTC reporting.
Politics and policies
While politics and changing trade policies around the world are mostly out your hands, there are still some interesting points to note. For example, the market does react to what U.S. President Donald Trump says: On November 1 at 9:09 a.m., Trump sent out a tweet that suggested trade discussions were moving along nicely with China. Soybean futures were trading at $8.53 per bushel at that moment, but by 9:20, 11 minutes after the tweet, they had rallied to $8.80/bu. That’s some pretty spooky stuff right there!
“I say it’s best to remain as optimistic as possible, otherwise you may find yourself looking back at sales you made at the low end of the market when there was some brightness on the horizon all along.”
At the time of writing this, the U.S. and China were just past the midpoint of a trade truce that runs until March 1. China had just approved imports on five new genetically-modified soybean and canola varieties, calling the move a goodwill gesture towards the U.S. But what happens after March 1? Will the U.S. and China have come to trade terms before then? It’s sounding more positive out there lately, and we were seeing some imports of U.S. soybeans into China. These are signs of some better times ahead for the soybean market, which would support canola as well. This is by no means a guarantee, but at least things are sounding a little more promising.
Look forward
The market has been buried by negative information lately, and that is common to see when we are approaching the lows. The market stress causes people to look straight down, looking for the worst case situations, and that’s usually when things start to turn around. I say it’s best to remain as optimistic as possible, otherwise you may find yourself looking back at sales you made at the low end of the market when there was some brightness on the horizon all along.