


Canola market snapshot
Canada exports 90 per cent of its canola as seed, oil or meal to almost 50 markets around the world, bringing billions of dollars into Canada. This article provides a snapshot of canola production and processing in Canada, key markets for Canadian canola seed, oil and meal, and canola’s competitors in the world vegetable oil market.
Canadian canola production
Harvested canola acres have remained consistent at close to 20 million the past four years, down from an all-time high in 2012. The Canola Council of Canada’s goal of 15 million tonnes of production and sales by 2015 was achieved and that benchmark seems well established, providing a good foundation for the next goal – 26 million tonnes of production and sales per year by 2025. This goal assumes 22 million acres of canola. Table 1 provides Statistics Canada numbers for the past five years, including an estimate for 2016-17.
Canadian canola export markets
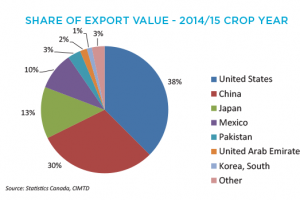
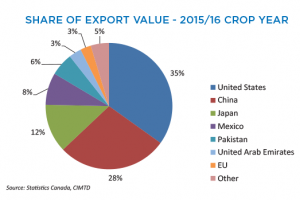
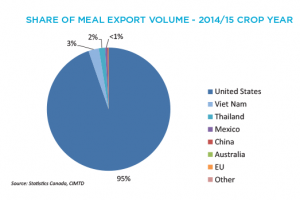
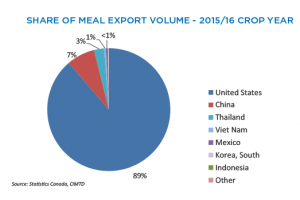
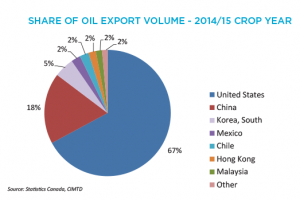
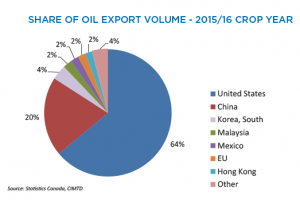
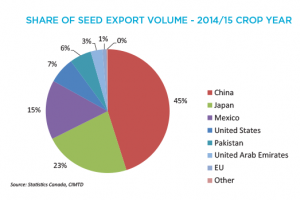
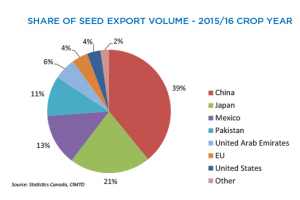
Canadian canola exports have risen in step with production. China is the biggest market for Canadian canola seed, taking 45 per cent of seed exports in 2014-15 and 39 per cent in 2015-16. (See the pie graphs.) The U.S. is the biggest market for Canadian canola oil, taking 67 per cent in 2014-15 and 64 per cent in 2015-16. The U.S. also takes most of our canola meal, importing 95 per cent in 2014-15 and 89 per cent in 2015-16.
Bruce Jowett, Canola Council of Canada vice president of market development, is encouraged to see China back in the meal market. “Our canola exports tend to rely on four big markets – the U.S., China, Japan and Mexico – but the meal market has been dominated by the U.S.,” he says. “Our goal with market development is to not only grow the overall size of the pie, but to also grow the number of participants sharing the pie.”
With meal in particular, the pie basically had just one participant. “The U.S. makes great use of our canola meal, especially in the dairy market, which is great obviously, but we’re pleased to see China back,” Jowett says. China wanted to make sure Canadian processing plants met Chinese approval for meal production before it would accept imports. At the same time, the CCC was working in China to help livestock and aquaculture producers understand how canola meal could fit into their rations. Meal exports to China in 2015-16 show that progress is being made on both fronts.
“Our goal with market development is to not only grow the overall size of the pie, but to also grow the number of participants sharing the pie.”
Jowett and his team also work in newer markets to expand their use of canola. South Korea has emerged as a significant customer among these second-wave countries.
| 2012-13 | 2013-14 | 2014-15 | 2015-16 | 2016-17 (est’d)* | |
|---|---|---|---|---|---|
| Harvested area (million acres) | 21.7 | 20.2 | 20.6 | 20.6 | 19.6* |
| Production (million tonnes) | 13.9 | 18.6 | 16.4 | 18.4 | 18.3 |
| Seed exports (million tonnes) | 7.3 | 9.1 | 9.2 | 10.2 | 9.0 |
| Domestic processing (million tonnes of seed crushed) | 6.7 | 7.0 | 7.4 | 8.3 | 8.0 |
Source: Statistics Canada. *Based on the September report.
“A lot of Canadian canola oil that goes into South Korea is sold as bottled oil in gift boxes, given out during Thanksgiving and Lunar New Year,” Jowett says. “Canola is the No. 1 or No. 2 off-the-shelf oil in South Korea.” Next steps for South Korea are to help people understand the value of the gift oil they’re receiving, and to get food processors and restaurants to use more canola oil.
Pakistan is another potential growth market, which – interestingly – is buying far more Canadian canola than its much larger neighbour, India, which buys almost none. Pakistan accounted for six per cent of Canadian canola seed exports in 2014-15 and 11 per cent in 2015-16.
“Pakistan tends to be a price-sensitive market, which we think has driven the rise in sales over the past two years,” Jowett says.
Global oilseed production and trade
USDA figures put total global canola and rapeseed exports for 2015-16 at 14.60 million tonnes. Statistics Canada puts canola exports of 10.2 million tonnes for 2015-16, accounting for 63 per cent of global trade. Global canola and rapeseed oil exports were 4.16 million tonnes in 2015-16, according to the USDA, of which 2.80 million – 67 per cent – came from Canada.
While Canada is the major canola seed and oil exporter, canola is third globally behind soybean and palm. Soybean dominates global oilseed exports, with 132.8 million tonnes traded in 2015-16. (See Table 2.) Canola and rapeseed are a distant second in seed trade. Palm, technically not an “oilseed”, is the major player in global vegetable oil production and trade. Palm oil edges soybean oil in global production and is by far the most dominant vegetable oil exported around the world. (See Table 3.)
For more on key export markets for Canadian canola, go to canolacouncil.org/markets-stats/markets/
| 2012-13 | 2013-14 | 2014-15 | 2015-16 | 2016-17 (August forecast) | |
|---|---|---|---|---|---|
| Seed production (million tonnes) | |||||
| canola/rapeseed | 64.06 | 71.67 | 71.45 | 68.37 | 67.16 |
| coconut | 5.72 | 5.42 | 5.43 | 5.31 | 5.51 |
| cottonseed | 46.37 | 45.02 | 44.33 | 36.99 | 38.55 |
| palm kernel | 15.09 | 15.98 | 16.57 | 15.95 | 17.42 |
| peanut | 39.79 | 41.40 | 39.84 | 40.47 | 41.09 |
| soybean | 268.57 | 282.46 | 319.78 | 312.67 | 330.41 |
| sunflower | 34.99 | 41.61 | 39.42 | 39.34 | 43.32 |
| Seed exports (million tonnes) | |||||
| canola/rapeseed | 12.56 | 15.10 | 15.07 | 14.60 | 13.54 |
| coconut | 0.07 | 0.11 | 0.11 | 0.09 | 0.08 |
| cottonseed | 0.92 | 0.84 | 0.65 | 0.52 | 0.61 |
| palm kernel | 0.04 | 0.04 | 0.03 | 0.04 | 0.04 |
| peanut | 2.66 | 2.90 | 3.30 | 3.61 | 3.79 |
| soybean | 100.80 | 112.72 | 126.13 | 132.80 | 138.97 |
| sunflower | 1.45 | 1.96 | 1.66 | 1.81 | 1.53 |
Source: USDA August 2016 http://apps.fas.usda.gov/psdonline/circulars/oilseeds.pdf
| 2012-13 | 2013-14 | 2014-15 | 2015-16 | 2016-17 (August forecast) | |
|---|---|---|---|---|---|
| Oil production (million tonnes) | |||||
| canola/rapeseed | 25.69 | 27.26 | 27.63 | 27.63 | 26.64 |
| coconut | 3.62 | 3.38 | 3.37 | 3.42 | 3.41 |
| cottonseed | 5.22 | 5.17 | 5.13 | 4.50 | 4.58 |
| olive | 2.50 | 3.19 | 2.54 | 3.09 | 3.01 |
| palm kernel | 6.72 | 7.13 | 7.39 | 7.16 | 7.66 |
| palm | 56.38 | 59.34 | 61.64 | 59.40 | 65.50 |
| peanut | 5.47 | 5.67 | 5.54 | 5.43 | 5.62 |
| soybean | 43.10 | 45.13 | 49.06 | 52.14 | 53.82 |
| sunflower | 12.90 | 15.52 | 14.91 | 15.13 | 16.55 |
| Oil exports (million tonnes) | |||||
| canola/rapeseed | 3.95 | 3.83 | 4.07 | 4.16 | 4.15 |
| coconut | 1.91 | 1.73 | 1.94 | 1.78 | 1.78 |
| cottonseed | 0.16 | 0.14 | 0.14 | 0.09 | 0.10 |
| olive | 0.91 | 0.86 | 1.02 | 0.94 | 0.97 |
| palm kernel | 3.26 | 2.88 | 3.22 | 2.99 | 3.17 |
| palm | 43.11 | 43.19 | 47.47 | 45.57 | 48.02 |
| peanut | 0.17 | 0.20 | 0.25 | 0.25 | 0.23 |
| soybean | 9.36 | 9.46 | 11.10 | 12.17 | 11.69 |
| sunflower | 5.57 | 7.77 | 7.39 | 7.89 | 8.78 |
Source: USDA August 2016 http://apps.fas.usda.gov/psdonline/circulars/oilseeds.pdf