


Canola: Strong in a challenging global market
Canadian canola producers are facing a rough time because of the trade conflict with China – a good reason to have a closer look at competitors. Of course, immediate competition is with other big and emerging canola producers such as Australia, the EU or Ukraine. But at the same time, canola oil is competing against soybean, sunflower and palm oils.
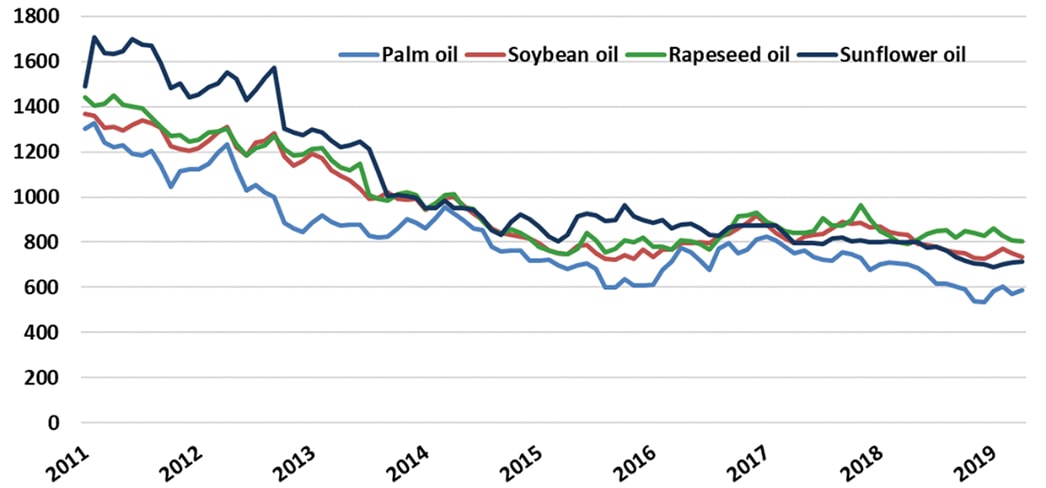
As shown in Figure 1, prices for these top four vegetable oils have been basically flat since 2015, but substantially lower than they were in 2011. However, most remarkably, canola oil is doing slightly better than the other oils (see green rapeseed oil line in chart). In fact, for about the past year, canola oil has traded at a premium over all other products by approximately US$50 per tonne. In former years, sunflower oil tended to be the priciest product.
This relatively strong development of canola oil prices is particularly remarkable when taking into account the Canadian–Chinese trade conflict.
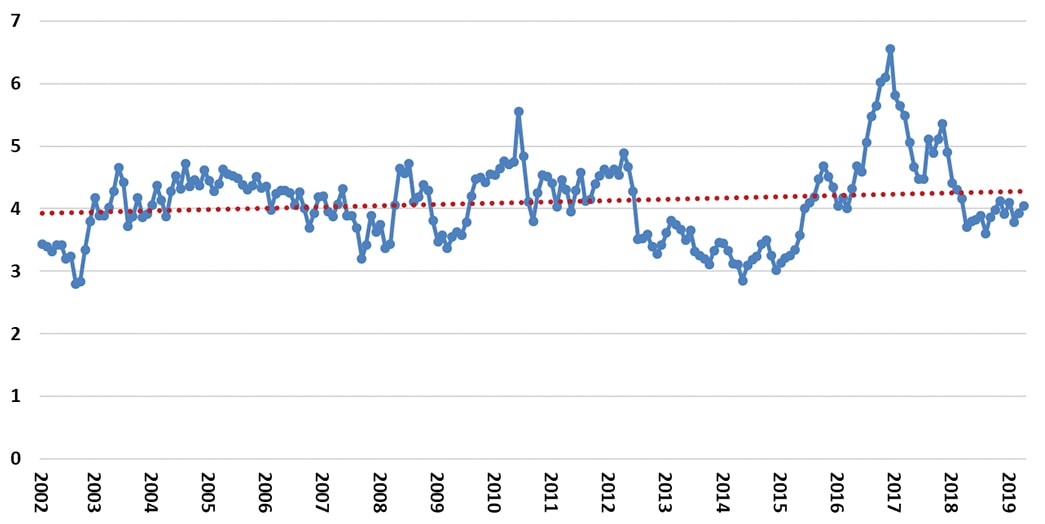
When concerned about the on-farm competitiveness of canola, the evolution of its relative price matters. Figure 2 shows that the price of canola oil is trending up relative to the price of wheat. This indicates that the downward trend in wheat prices – wheat is the key rotational crop for canola producers in Canada, Europe, Australia and Ukraine – has been slightly stronger than in canola. This implies that in terms of product prices, the on-farm competitiveness of canola has improved since the early 2000s.
This graph shows the canola oil price relative to the wheat price. Points on the blue line are derived from dividing the canola oil price by the wheat price. The dotted line represents the trend value from a linear regression, showing that canola oil prices are trending up relative to wheat. Source: World Bank (2019)
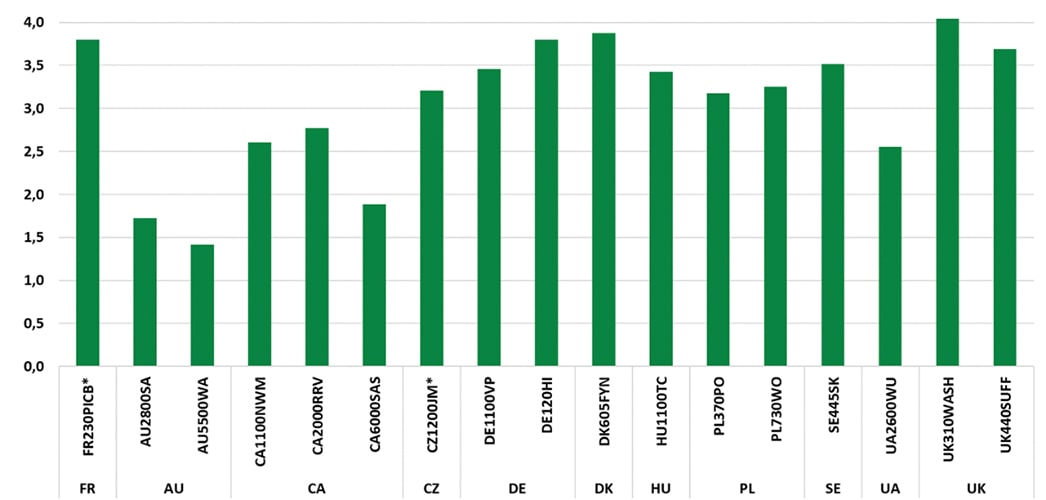
To get a better idea how these framework conditions impact actual on-farm economics for typical canola growers around the world, we can analyze results from the agri benchmark Network of typical farms. Figure 3 gives an overview regarding canola yield levels of typical farms in Canada, Australia and various European countries. One of the most remarkable findings: In former times, there was a yield gap between Canadian and Western European growers of about two tonnes per hectare (approximately 35 bu./ac.) or even more. Due to significant yield canola improvement in the Prairies and lower yields in the EU, this gap has shrunk, although the typical farm in Saskatchewan did experience some unusual yield issues in 2017 and 2018. Whether or not EU farmers will continue to achieve lower levels than before remains to be seen, but given their increasing issues in having access to proper crop care products and restrictions in nitrogen application, an ongoing lower yield level is reasonable.
But, of course, yields are just one side of the coin – what about cost and revenues? Figure 4 compares of total cost per tonne of canola with and without land cost for each farm. From this graph the following findings can be drawn:
- Canadian farms tend to be very competitive and very profitable – though the yield issues of the Saskatchewan farm have been noted.
- Despite the fact that Canadian canola has to be shipped for at least 1,500 km, farm gate prices are only marginally less than in Europe. This is an indication of a rather strong value chain.
- The newcomer Ukraine is a real low-cost producer and very profitable – which is why rapeseed acreage is increasing rather strongly in Ukraine.
- With the exception of the Hungarian farm, EU farms show higher cost of production than their international peers. Some of them struggle to cover total cost plus land cost – even when including direct payments. This is one driving factor for the canola acreage in Germany, the UK or France to decline.
Whether or not growers continue to grow canola, of course, depends on its relative performance compared with other crops. Hence, Figure 5 (see next page) demonstrates the on-farm competitiveness of canola vs. wheat. We choose “return to land” as the performance indicator. It represents the gross revenue minus total cost (excluding land cost). It has to be highlighted that, of course, wheat is not directly competing against canola. However, because wheat is a key element of all the rotations of the typical farms in this comparison, it is used as a benchmark.
From Figure 5 it can be concluded that, for the Canadian benchmark farms – even for the one in Saskatchewan – rapeseed is a cash cow in comparison to wheat. This is also the case for many other farms around the world, although not for Germany, France, Denmark and Australia. The Australian canola-wheat comparison is a surprise for a major competitor of Canada in global canola markets.
For the farm names, the first two letters indicate the country, the numbers represent the size of the farm in hectares and the appendix shows the region in the country where the typical farm is located. FR is France, AU is Australia, CA is Canada (farms in Northwest Manitoba, Red River Valley and Saskatchewan), CZ is Czech Republic, DE is Germany, DK is Denmark, HU is Hungary, PL is Poland, SE is Sweden, UA is Ukraine and UK is United Kingdom.
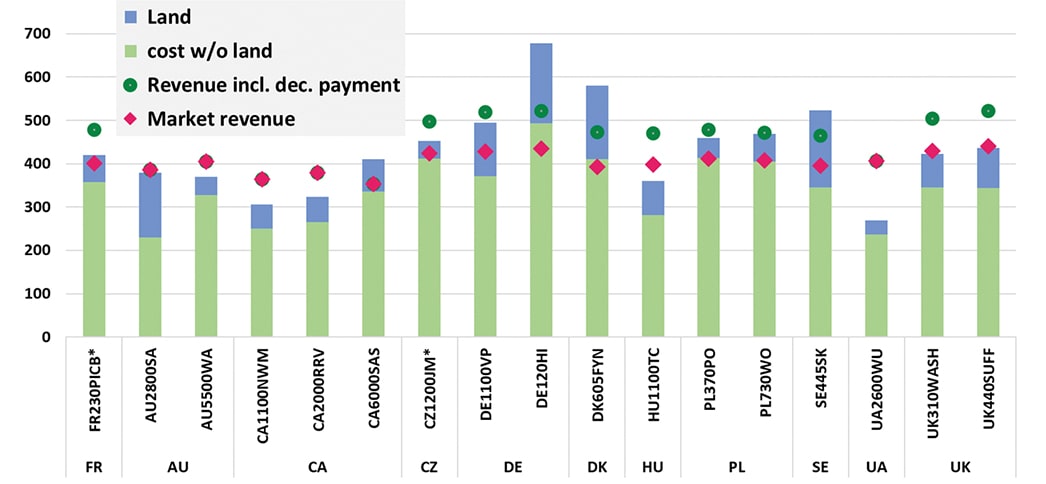
Figure 4 compares of total cost per tonne of canola with and without land cost for each farm. The red dots indicate farm gate prices in US$ per tonne and the green dots show total revenue including decoupled payments, which are relevant only for EU farms. Source: agri benchmark (2019)
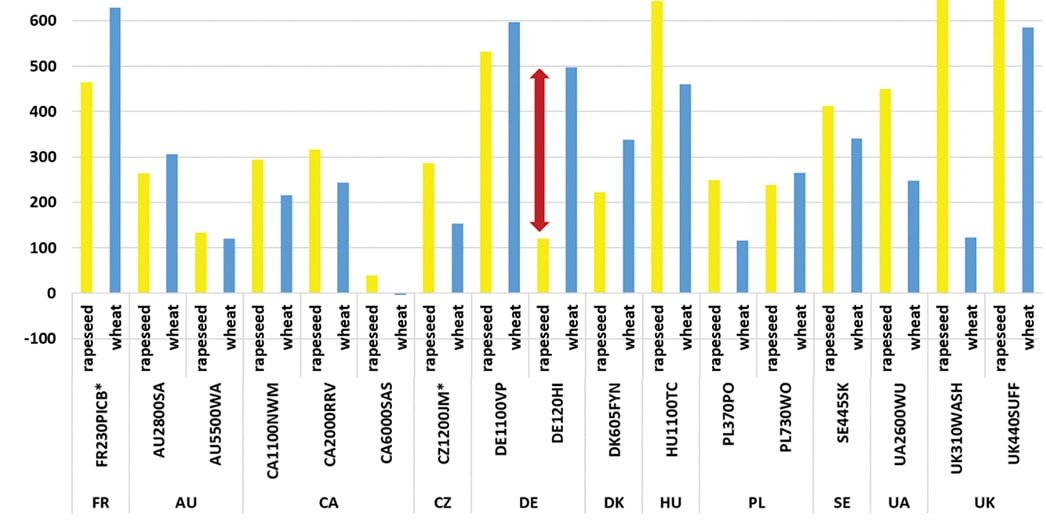
Figure 5 demonstrates the on-farm competitiveness of canola vs. wheat. “Return to land” represents the gross revenue minus total cost (excluding land cost). For most farms, particularly in Canada, canola is much more profitable than wheat. Source: agri benchmark (2019)
The bottom line: Despite the trade conflict with China, so far, canola seems to perform rather well when compared to other vegetable oils. Furthermore, the evolution of relative prices also favours canola. Consequently, canola has been a rather profitable crop for Canadian producers as well as for many others around the globe. In particular, newcomers in Ukraine or Hungary seem to benefit a lot from the positive framework conditions.
On the other hand, in traditional canola-producing countries, canola is under severe economic pressure. The challenge is that many EU farms have a rather limited number of alternatives – in particular when it comes to broadleaf crops, which are badly needed as a break crop for highly wheat-based rotations. Therefore, most of them will stick with canola, even if it is a less profitable crop.
The crop alternatives situation is different for many Canadian growers – they can very successfully produce other broadleaf crops such as pulses. Given the steep increase in global demand for pulses, this option might become even more important in future. agri benchmark will keep track of that development.