Apply enough nitrogen
Key practice: Use soil tests, ideally taken at consistent locations (GPS helps), and base rate decisions on soil test recommendations.
Key research: S.A. Brandt, Agriculture and Agri-Food Canada (AAFC), et al.“Seeding rate, fertilizer level and disease management effects on hybrid versus open pollinated canola (Brassica napus L.)” Canadian Journal of Plant Science, 2007.
R.E. Blackshaw, AAFC, et al. “Canola response to ESN and Urea in a four-year no-till cropping system”, Agronomy Journal, 2011.
Nitrogen is the most common limiting nutrient for canola production. The challenge is to choose a nitrogen rate that balances the high yield potential of hybrid canola with the economic return from the extra pounds of nitrogen required to meet that potential. Applying enough fertilizer to meet the crop’s yield potential is not always the most economic decision.
The first step in making the decision is to understand how much nitrogen canola needs. The Canadian Fertilizer Institute (CFI) has a nutrient uptake and removal table (developed based on a culmination of science from the 1990s) that can be used to demonstrate typical nutrient needs. The CFI table says a 35 bu./ac. canola crop takes up 100 to 123 lb./ac. of nitrogen, or roughly 3 to 3.5 pounds for each bushel. A 50 bu./ac. crop would need 150 to 175 lb./ac. of available nitrogen.
Not all of this has to come from fertilizer, given that soil reserves and organic matter mineralization will provide some of that total. This brings us to the second step in decision-making: a soil test.
A benchmark sample is an effective and economical way to test every field every year. Select one or more small representative areas in a field. Take 15
to 20 soil cores from each area and mix them to create a composite sample to submit for analysis. Use GPS to return to the benchmark location year after year to get a better indication of soil nutrient trends over time. These trends can be used to assess whether fertilizer application rates for crops throughout the rotation are adequate, excessive or deficient. (For more on soil sampling techniques, go to www.canolawatch.org and search for the article “How to take a good soil sample.”)
Various studies have looked at nitrogen rates for hybrid canola. S.A. Brandt of of Agriculture and Agri-Food Canada (AAFC) et al, published: “Seeding rate, fertilizer level and disease management effects on hybrid versus open pollinated canola (Brassica napus L.)” in the Canadian Journal of Plant Science in 2007. In that study, Brandt compared three nitrogen levels — 67, 100 and 133 percent of the commercial recommended rate — and concluded that the high rate generally increased the total yield of biomass and seed.
R.E. Blackshaw of AAFC et al published: “Canola response to ESN and Urea in a four-year no-till cropping system” in Agronomy Journal in 2011.
In that study, Blackshaw compared various inputs, including nitrogen at 50, 100 and 150 percent of the recommended rate. The study concluded that canola responded positively to the 150 percent rate compared to the 100 percent rate about half the time.
Finding a practical balance will depend on the potential economic return from added nitrogen for each field, as well as consideration of the moisture situation, equipment logistics and grower appetite for risk. In both the Brandt and Blackshaw studies, the yield jump when going from the recommended nitrogen rate to 133 percent (Brandt) or 150 percent (Blackshaw) of the recommended rate was not huge. Both of these studies reflect the long-accepted economic response curve for nitrogen, which shows a fairly flat top to the curve over a wide range of rates.
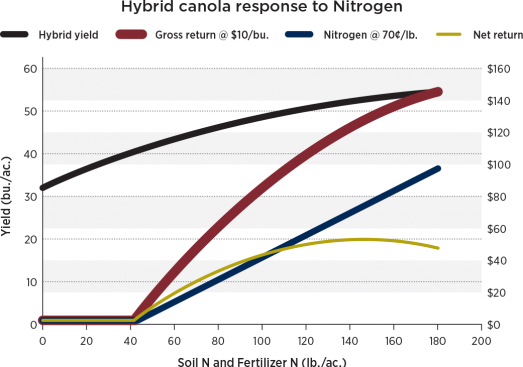
The following information refers to the graph, which was generated using information from the nitrogen calculator (available here: www.gov.mb.ca/agriculture/online-resources/decision-making-tools.html). The point at which the net return (NR) line is greatest (goes flat) represents the maximum economical rate of N (MERN) — $1 invested in N will return $1 in revenue.
Whether a grower wants to apply this rate will depend on risk factors.
For example:
- Moisture conditions during the growing season greatly affect the response to fertilizer N, but growing season weather isn’t predictable. Dry conditions may reduce yield potential, which will drop the gross revenue (GR) line and shift the NR line to the left. The most economic nitrogen rate may be lower in that case.
- Ideal moisture conditions and better price prospects may increase the GR line’s potential, shifting the NR line to the right and improving the return on investment for extra nitrogen. Growers with a higher appetite for risk may apply nitrogen rates at or above the current MERN (the last 10 lb./ac. of N provides a 1:1 return on investment according to the model) expecting the model conditions to improve and the MERN to increase.
- Growers with a lower appetite for risk will notice that the NR line is fairly flat over a wide range of nitrogen rates. They may opt for a rate lower than the MERN. They may prefer a rate where the last 10 lb./ac. of nitrogen applied will provide $1.25 or $1.50 return on each $1 invested instead of a 1:1 return.