


The science behind the Canola Calculator
The Canola Council of Canada launched the Canola Calculator in 2017 to help farmers find the most profitable balance between seeding rate and yield potential.
“In regular surveys with farmers, canola plant stand establishment always ranks very high on the list of production challenges,” says Ian Epp, agronomy specialist with the Canola Council of Canada. “Seed represents one of the biggest costs for canola growers, so maximizing this upfront investment is important. The calculator was developed to help canola growers set an accurate seeding rate to achieve target plant stands and profitability goals and to manage risk.”
The Canola Calculator has two components: target plant density calculator and seeding rate calculator.
“The plant density calculator has built in sliding scales to allow growers to be as specific as they like for various factors,” says Epp. “For example, early-seeded crops may be at higher risk to frost, while late-seeded canola is probably a lot less, so growers can adjust for those differences. If there are a lot of flea beetles this fall on the fields you plan to grow canola next year, then perhaps insect pressure might be a bit higher. Or perhaps weeds are more of a problem in some fields. The calculator makes it easier to customize for specific factors.”
Once the target density is calculated, the information can be saved to a ‘My fields’ folder online, printed or sent by email.
Next, go to the seeding rate calculator, which will already have the target plant density populated, and add thousand seed weight (TSW) and estimated survival. “For many farmers, estimating survival is probably the biggest factor they’ll struggle with when using the calculator,” explains Epp. “The industry average for canola across western Canada is 60 per cent survival, and although growers may think they are better than that, we rarely see fields any higher than 70 per cent.”
Unless growers have gone out and completed plant stand counts in their fields, using 60 per cent is recommended. “Fall is a great time to go out and actually do some plant counts in your fields to determine what your final plant density was at harvest,” Epp says. “Start collecting your own data, so in the future you can customize the calculator to your specific management.”
Epp encourages growers to think about their willingness to take risks and weigh all the factors before lowering seeding rates. For example, targeting lower plant stands like 4 or 5 plants per square foot is riskier than 6 to 10 plants per square foot. “If you reduce seeding rates to 4 plants and one is lost to flea beetles for example, that is a quarter of your crop gone. However, with 6 or 7 plants per square foot, potential for yield loss will be much less if you lose one plant per square foot.”
Another risk with low plant stands can be weed or insect management applications that may not have been necessary with a more competitive crop stand, Epp adds.
The calculator project is a result of direct farmer investment through their canola organizations. “The outcomes make it pretty clear that it has been a good use of farmer money to improve farming practices,” Epp says. “Some growers will be able to cut seeding rates and still have successful high-yielding canola crops. On the other hand, some growers will recognize that higher seeding rates are better for their operation to sustainably get that higher-yielding crop right from the beginning.”
Behind the Calculator
“It takes a lot of background research, manpower, time and energy to get tools like the calculator into growers hands. This handy calculator is an example of a great extension tool that is available because of grower and industry investment dollars.”
Recent research and crop surveys clearly identified the need for establishing seeding rates based on TSW and target plant density. About half of western Canadian growers have crop densities less than recommended optimal levels, which increases risk for yield and quality losses. An online seeding rate calculator was recommended.
The calculator was developed and built based on several years of research data from various projects. Murray Hartman, provincial oilseed specialist with Alberta Agriculture and Forestry, recently updated his original plant population meta-analysis, which formed the foundation of the calculator.
“Although early seeding rates were developed based on research using a combination of open-pollinated and hybrid data, by the mid-2000s we started to separate the data as more hybrid research became available,” explains Hartman. “Growers and agronomists were seeing more vigorous plant stands and better weed control, and began to question if lower plant stands would make sense. We updated the data and Steven Shirtliffe at the University of Saskatchewan conducted a meta-analysis of over 35 research projects in 2009. The project, funded by SaskCanola and Alberta Canola, showed that lower seeding rates and plant populations could be economical. However, we found sparse data for canola production using very low target plant stands, and over the next few years more projects focused on providing that information.”
Hartman used all of the data from various seeding-rates studies for hybrids specifically to update his plant population analysis. He confirmed that the actual physical response of hybrids now is different from the previous response with open-pollinated canola. Also, because the price of hybrid seed is dramatically different, it needs to be treated as an economic input like nitrogen fertilizer. The economics are very different for seed at $1 per pound versus $15 per pound.
“This was the real driver behind the calculator. It helps growers achieve the best economic returns for their seed investment,” says Hartman. “A minimum target density of 5 to 7 plants per square foot is still a reasonable target range. Some growers currently using higher seeding rates may be able to lower their rates without sacrificing yield or quality and without big economic impacts. However, going too low may sacrifice yield, and increase risk and quality issues. The majority of growers are already at the minimum of 4 to 5 plants per square foot, but a third of growers are less than that, which means they may be sacrificing yield and quality.”
SaskCanola director Bernie McClean has tested and used the new Canola Calculator. He sees it as a very handy tool. “Going through the tool and reading the information and helpful hints provided is a good place to start,” says McClean. “It works on your phone and it’s easy to use and see the results. The thousand seed weight (TSW) is key and can really affect the recommended seeding rate. I typically target closer to 10 plants per square foot because I am pushing the growing season frost-free length on my farm near Glaslyn. Higher plant counts reduce the amount of branching on the plants, thus reducing the time to maturity.”
Seed-weight effect
Last spring, McClean’s canola seed lots varied from 3.86 to 4.5 grams per TSW. Using his target of 10 plants per square foot and the base 60 per cent average survival rate, the calculator’s recommended seed rate is 6.2 lb./ac. for his 3.86-gram seed and 7.2 lb./ac. for his 4.5-gram seed.
“Although I knew TSW made a difference, it wasn’t until I started using the calculator that I really realized how much of a difference,” says McClean.
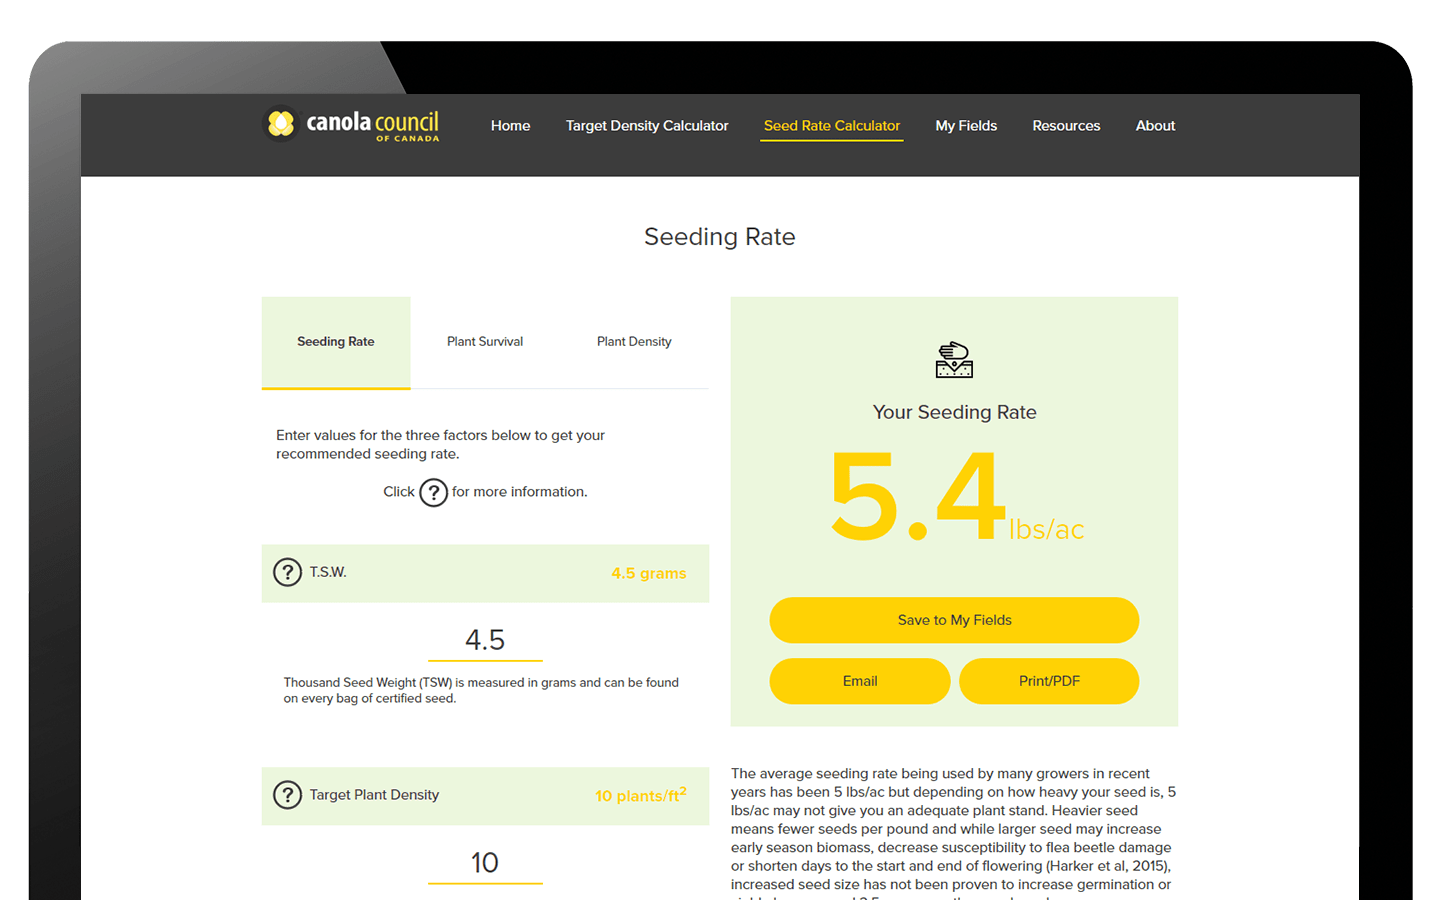
Because McClean switched to an independent opener hoe drill, he figures his survival rate is closer to 80 per cent. “To confirm this, I do actual plant counts in the fall after swathing,” he says. “The actual survival rate has a serious impact on the financial wellbeing of an operation, so this is an important step.”
Going back into the calculator, if he increases seed survival to 80 per cent, this lowers the seeding rate to 5.4 lb./ac. for his 4.5-gram seed.
McClean, who is also chair of the SaskCanola Research Committee, sees the calculator as a great example of grower payback from an investment into research and extension tools. The many research studies that formed the foundation of the calculator were supported and funded by Alberta Canola, SaskCanola and Manitoba Canola Growers. The calculator was developed and released with funding by the Canola Council of Canada.
“It takes a lot of background research, manpower, time and energy to get tools like the calculator into growers’ hands,” McClean says. “This handy calculator is an example of a great extension tool that is available because of grower and industry investment dollars.”