


Harvest losses and their causes
PRINCIPAL INVESTIGATOR:
Rob H. Gulden, University of Manitoba, Winnipeg, MB
COLLABORATORS:
Neil Harker, Linda Hall, Steve Shirtliffe, Chris Willenborg
PUBLISHED:
Cavalieri A, Harker KN, Hall LM, Willenborg CJ, Haile TA, Shirtliffe SJ, Gulden RH (2016) Evaluation of the causes of on-farm harvest losses in canola in the northern Great Plains. Crop Science 56: 2005-2015.
On-farm harvest losses in canola are a complex phenomenon influenced by environment and management-specific factors. Several variables suggest that, in some cases, harvest losses can be reduced by altering harvest practices.
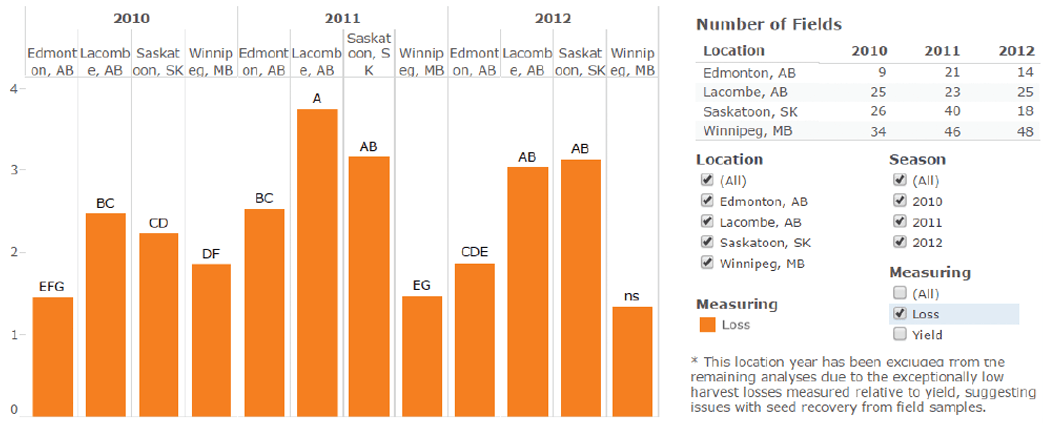
Here is table 1 as it appears on the Canola Research Hub at canolaresearch.ca. At the Hub, users can click or un-click the boxes to view total yield as well as loss in bu./ac., or filter by location or year.
Rob Gulden with the University of Manitoba led a survey of harvest loss in canola on 310 fields across Western Canada from 2010 to 2012. This information was used to determine whether harvest losses are similar across production areas of Western Canada, what factors strongly contribute to harvest losses, and if harvest losses in canola have changed over the past decade. Table 1 shows the overall average losses in bushels per acre for each of the four locations by year, and data on the side show fields surveyed per location per year.

With P values less than 0.05, results from Lacombe and Saskatoon indicate a significant effect based on location.
In general, canola harvest losses from 2010 to 2012, as a percentage of yield, were similar to losses reported 10 years ago (Gulden et al. 2003). However, generally higher yields of modern cultivars have resulted in greater absolute total harvest losses. This represents lost revenue for producers, and adds more seed to the volunteer canola seedbank.
Some producers had very low losses while others had very high losses. Of the fields surveyed around Saskatoon, for example, the lowest loss was 3.8 percent and the highest was 11.2 percent. Of the producers surveyed around Lacombe, the lowest loss was 2.3 percent and the highest was 9.4 percent. These results suggest that management decisions at the producer level contribute to harvest losses in canola, and that some producers can consistently achieve lower harvest losses than others.
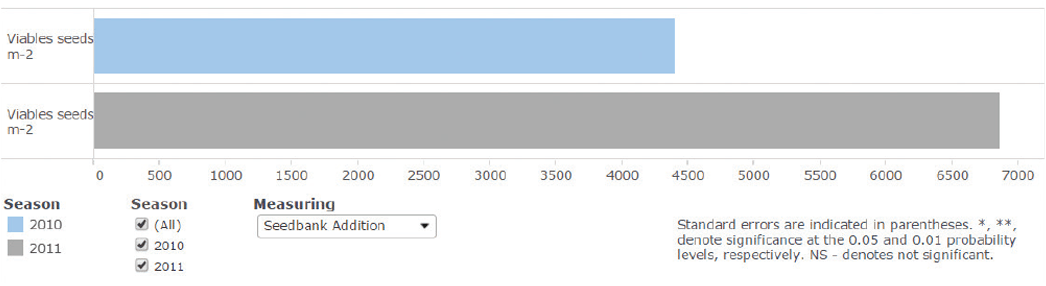
This shows only the number of viable seeds lost per square metre, on average, for years 2010 and 2011 of the study. At the Hub, users can also view harvest losses (as % of yield or kg/ha), TKW or total yield in kg/ha by changing the “Measuring” tab.
Conclusions
Some reduction in proportional total harvest losses in canola is possible through improved management.
The survey included five Saskatchewan farms that both swathed and straight combined canola. No differences in harvest losses were observed in a side-by-side comparison between swath-harvested and direct-harvested canola on these farms. This is an encouraging result; however, the number of producers who direct-harvested canola was low and a more thorough investigation is warranted if direct-harvesting becomes a more popular method.
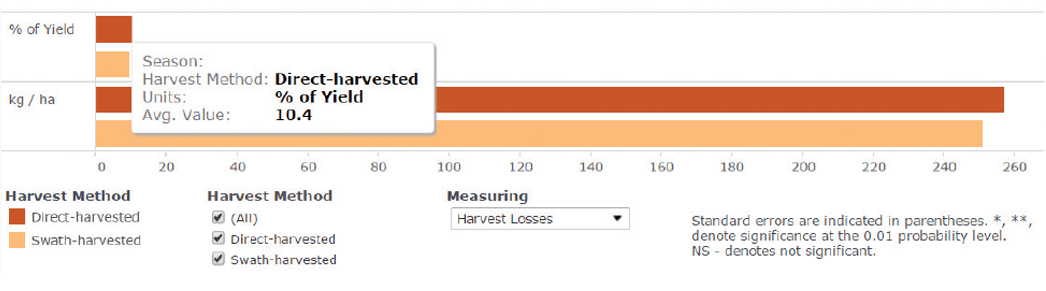
as influenced by harvest method
This graphs compares harvest losses (total and percent of yield) for swathed versus straight combined canola. At the Hub, users can also compare the two methods based on seedbank addition (viable seeds/m2), TKW or total yield in kg/ha.
While higher combine ground speed increased harvest losses, there was no evident difference between combine brands used in these surveyed fields. Combine manufacturer and combine type (rotary or conventional) did not influence the total proportion of canola harvest losses.
Application of a fungicide at flowering did result in a reduction of proportional harvest losses of 1.4 percent, but absolute losses were not affected. This may suggest the fungicide played a role in increasing yield, or that fungicide applications were targeted only at fields with higher yield potential.
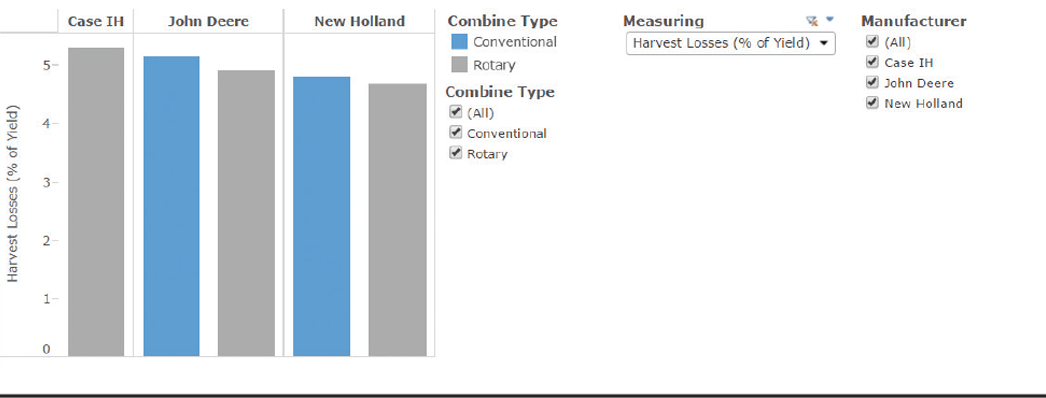
Combine type did not make a significant difference, based on the combines used in fields surveyed. At the Hub, users can see how many fields each brand and type harvested (Case IH data is based on 62 fields, for example), and view losses in kg/ha.
Choice of variety may play a role in canola harvest losses. Results from this survey suggest that this is not a dominant role and that other factors may be equally or more important in contributing to total harvest losses in canola.
No differences in proportional or absolute total harvest losses were attributable to the time of day of swathing. Similarly, time of day of combining, on its own, could not be identified as a significant factor contributing to total harvest losses.
Proportional harvest losses decreased with increasing canola yield. Management factors that contribute to high canola yield and earlier swathing dates, such as adequate canola plant density, resulted in proportionally lower harvest losses.